Trend
A market trend indicates the prevailing direction in which the price of an asset is moving. It can often be identified by the current price relative to key moving averages like the 50-day moving average. For example, if a stock’s recent price is consistently above its 50-day moving average, it suggests the shares may be in an “uptrend” – signaling a potential continuation of price gains. Trend metrics help traders time their bets based on technical factors that should help predict future asset price movements based on historical patterns.
See Full Glossary >
Why should I care about trends?
For markets: Trends help short-term traders time their bets based on historical patterns. Trends may also help investors time their investment decisions to maximize their long-term returns.
The bigger picture: Tracking trends is a form of “technical analysis”, which asserts that past trading affects future movements – that market patterns repeat, driven by the psychological reactions of traders. That runs counter to academic theories (known as the efficient market hypothesis) that investors can conclude nothing from the past, and that only new information affects market prices.
What are the different types of directional trend?
Uptrend: If the stock price is consistently higher than its 50-day moving average, it suggests that the stock is in an uptrend. This is typically seen as a bullish signal, indicating that the stock might continue to rise.
Downtrend: If the stock price is consistently below its 50-day moving average, the stock is considered to be in a downtrend. This is generally viewed as a bearish signal, suggesting that the stock might continue to fall.
Sideways trend: When the stock price fluctuates around its 50-day moving average without a clear pattern of consistently being above or below it, the stock is said to be in a sideways or range-bound trend, indicating a lack of clear market direction.
How do you identify market trends?
Price analysis
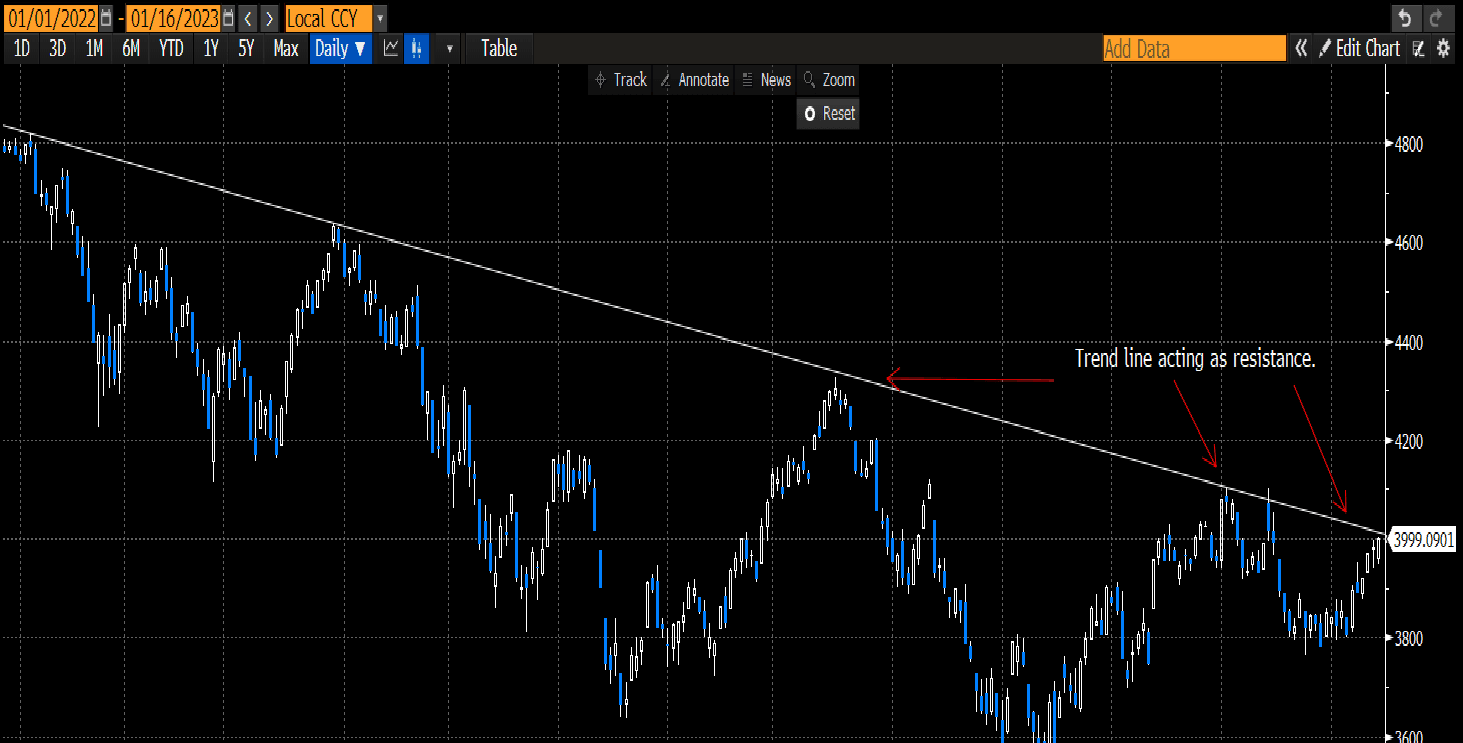
Trendlines: Trend lines are used to analyze price movements over both short and long periods. As a rule of thumb, your trend line should connect at least two points on a chart (i.e. two lows on a price chart in an uptrend, or two highs in a price chart on a downtrend), which you then extend over a longer period to see where pricing may encounter upside resistance (a kind of ceiling) and downside support (a kind of floor) in the future.
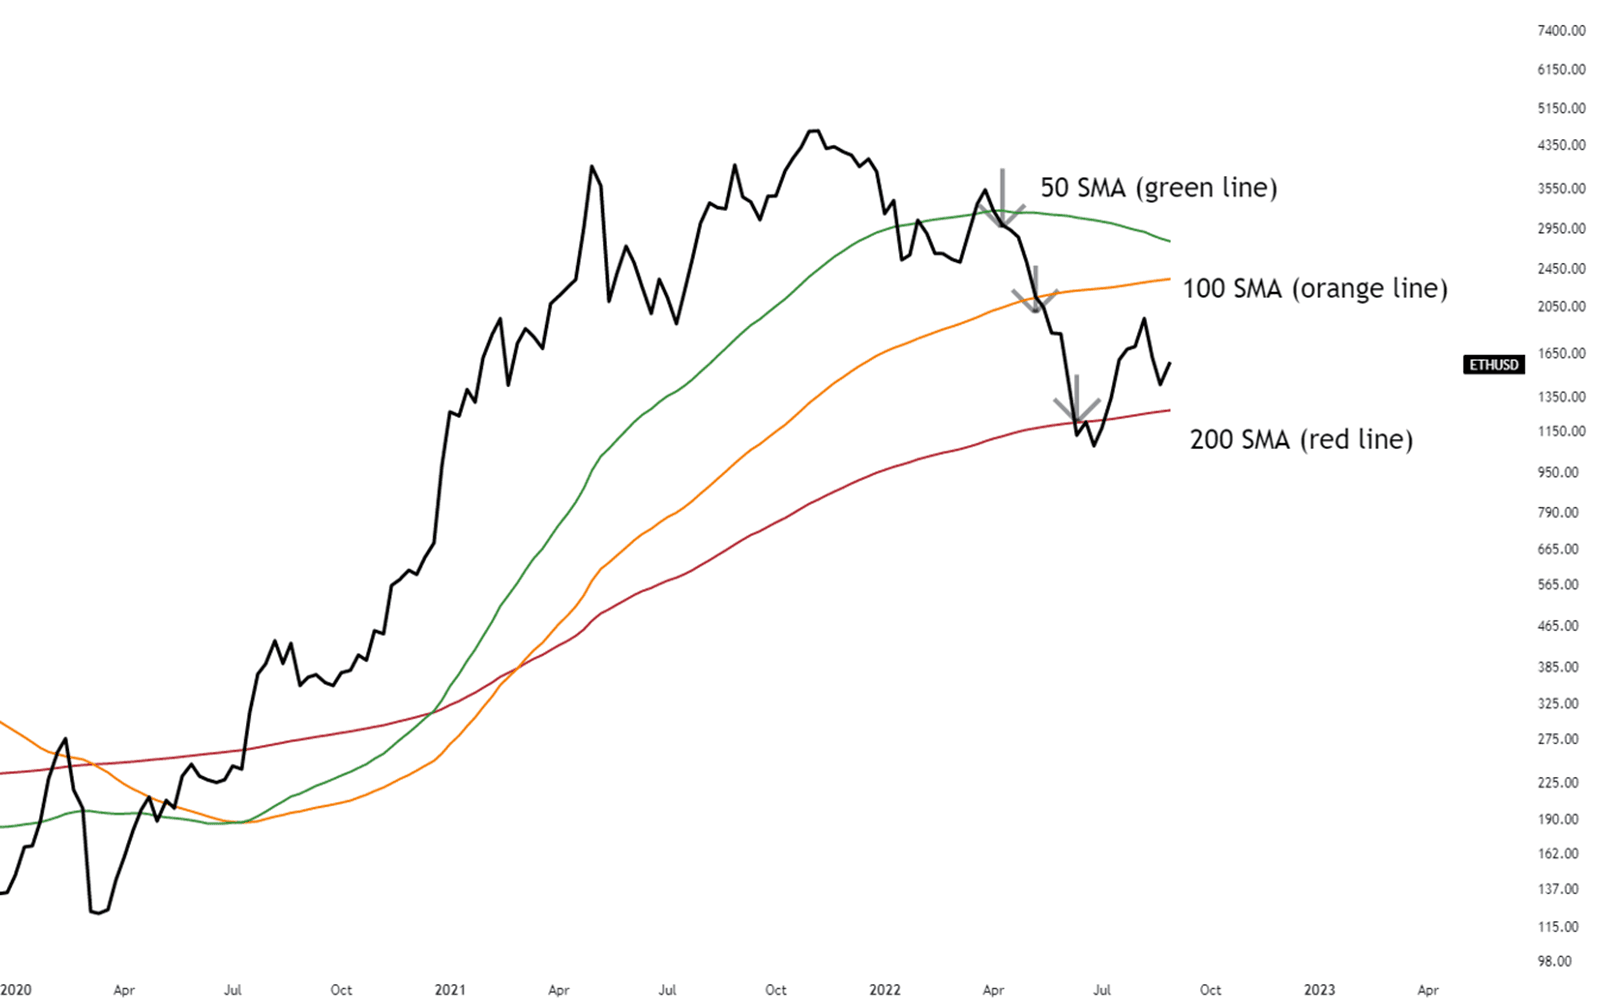
Moving averages: Moving averages work out a continually updating average price of an investment over a set number of previous trading periods: hours, days, weeks, or even months. It smooths out price data to create a single flowing line, making it easier to identify the direction of the trend. Commonly used moving averages include the 50-day, 100-day, and 200-day moving averages.
Price patterns: Recognizable patterns on charts like “head and shoulders”, “double tops”, and “triangles” can signal potential reversals or continuation of trends.

Other technical indicators to consider
Relative Strength Index (RSI): This momentum gauge measures the speed and change of price movements – and it can give you an idea of which way the market is headed. The indicator compares the relative strength of buyers and sellers – and that can tell you which side is driving the overall trend. It’s typically displayed as a line graph with a scale of 0 to 100. When it's closer to 100, buyers are controlling the price action and when it’s closer to zero, it’s the opposite and sellers are in control. Technical analysts typically see an RSI value above 70 as “overbought”, meaning there’s potential for prices to fall, and a value below 30 as “oversold”, suggesting upside potential.

Here’s an example: the lower panel of the chart shows the RSI rose above 70 in August 2022 and fell below 30 in September. The upper panel shows the S&P 500’s level over the same period, and the middle panel shows your theoretical profit (excluding fees) if you shorted the S&P 500 when the RSI was above 70 and bought it when it was below 30.
Moving Average Convergence Divergence (MACD): The MACD indicator, like the RSI, is a momentum gauge. It’s calculated by subtracting the 26-day exponential moving average (EMA) from the 12-day EMA, which gives you the MACD line. A nine-day EMA of that line is the “signal line”. And if you plot that signal line against the MACD line, it sends important “buy” or “sell” signals – highlighting when a stock’s momentum is changing course.

In the chart, the bottom panel shows the six bullish signals and six bearish ones over the period, based on the relative positioning of the MACD line and the signal line. The top panel shows the points at which you’d have bought and sold the S&P 500 if you were following the indicator. The middle panel shows the profit you’d have earned (excluding fees) from the trades.
Volume analysis: Analyzing volume can help assess the strength of a trend. Rising volume during an uptrend suggests strong buyer interest and supports the trend’s continuation. Similarly, increasing volume during a price downtrend might confirm strong selling pressure.

Here’s another example: alongside Supermicro’s share price rise, the volume of trades – i.e. the number of shares traded, shown in the bottom panel of the chart – is rising too. That gives investors an indication of how strong and potentially sustainable the move might be. In Supermicro’s case, rising volumes suggest traders have a lot of conviction in the move and could mean the price trend is more likely than not to continue (all else being equal).
The importance of trend analysis
Trend analysis helps investors navigate the complexities of financial markets. By identifying the prevailing direction of market prices, investors and traders can decide on when to enter or exit positions. Utilizing trend analysis aids in forecasting potential price movements, and enhancing strategies for buying, selling, and risk management. It also supports traders in setting stop-loss orders to safeguard investments and helps optimize trade timing to maximize profits. Additionally, understanding trends can alert traders to shifts in market dynamics, allowing for adjustments in strategies to better align with current market conditions.
Are trends foolproof?
While they can provide valuable insights, trends are by no means foolproof. Relying solely on trends can be misleading: after all, past performance does not guarantee future results. Trends might generate false signals and can be disrupted by unexpected market shifts or anomalies. Moreover, trends deliberately don't account for all variables: for instance, macroeconomic policies, geopolitical events, and industry and company-specific news all have the potential to significantly influence market movements. Investors, then, ought to consider a wider array of data – a mix of technical, fundamental, and sentiment analysis, say – and remain cautious of the risks associated with following a single dataset without comprehensive research and a well-rounded investment strategy.